Source
import numpy as np
import matplotlib.pyplot as plt
from labellines import labelLines
from myst_nb import glue
from scipy.constants import k, eV

def find_turning_points(x, potential, energy):
    """
    Find the left and right classical turning points for a given energy level.

    Parameters:
        x (np.ndarray): Array of distances.
        potential (np.ndarray): Potential energy values corresponding to x.
        energy (float): The energy level for which to find the turning points.

    Returns:
        tuple: (x_left, x_right) where each is the interpolated turning point.
               Returns (None, None) if fewer than two intersections are found.
    """
    diff = potential - energy
    indices = np.where(np.diff(np.sign(diff)))[0]
    if len(indices) < 2:
        return None, None

    i_left, i_right = indices[0], indices[-1]
    x_left = x[i_left] - diff[i_left] * (x[i_left+1] - x[i_left]) / (diff[i_left+1] - diff[i_left])
    x_right = x[i_right] - diff[i_right] * (x[i_right+1] - x[i_right]) / (diff[i_right+1] - diff[i_right])
    return x_left, x_right

def morse_potential(x, D_e, a, r_e, offset=0):
    """
    Compute the Morse potential.

    Parameters:
        x (np.ndarray): Array of distances.
        D_e (float): Depth of the potential.
        a (float): Width parameter.
        r_e (float): Equilibrium distance.
        offset (float): Energy offset (default is 0).

    Returns:
        np.ndarray: Morse potential evaluated at x.
    """
    return D_e * (1 - np.exp(-a * (x - r_e)))**2 - D_e + offset

def compute_vibrational_levels(v_levels, T_e, omega_e, omega_ex_e, D_e):
    """
    Calculate vibrational energy levels using the anharmonic oscillator formula.

    Parameters:
        v_levels (np.ndarray): Vibrational quantum numbers.
        T_e (float): Electronic term energy.
        omega_e (float): Harmonic frequency.
        omega_ex_e (float): Anharmonicity constant.
        D_e (float): Depth of the Morse potential.

    Returns:
        np.ndarray: Vibrational energy levels.
    """
    return T_e + omega_e * (v_levels + 0.5) - omega_ex_e * (v_levels + 0.5)**2 - D_e

def plot_electronic_levels(ax, x, ground_state, excited_state, kT, r_e):
    """Plot the ground and excited electronic energy curves."""
    ground_line, = ax.plot(x, ground_state / kT, color='blue', linewidth=2, label='ground')
    labelLines([ground_line], xvals=[2], zorder=2.5)
    excited_line, = ax.plot(x, excited_state / kT, color='red', linewidth=2, label='excited')
    labelLines([excited_line], xvals=[2], zorder=2.5)
    ax.set_xlabel("Distance")
    ax.set_ylabel("Energy ($k_{\\text{B}}T$)")
    ax.grid(True)
    ax.set_title("Electronic Levels")

def plot_vibrational_levels(ax, x, ground_state, E_v, kT, r_e):
    """Plot vibrational levels as horizontal lines and overlay the ground state potential."""
    for i, energy in enumerate(E_v):
        x_left, x_right = find_turning_points(x, ground_state, energy)
        if None not in (x_left, x_right):
            line, = ax.plot([x_left, x_right], [energy / kT, energy / kT],
                            color='green', label=f'{i}')
            labelLines([line], xvals=[r_e], zorder=2.5)
    ax.plot(x, ground_state / kT, color='blue', linewidth=2, label='Ground state')
    ax.set_title('Vibrational Levels')
    ax.set_xlabel("Distance")
    ax.grid(True)

def plot_rotational_levels(ax, x, ground_state, E_rot_total, kT, r_e, xmin_rot, xmax_rot):
    """Plot rotational levels for the v=0 vibrational state."""
    for i, energy in enumerate(E_rot_total):
        x_left, x_right = find_turning_points(x, ground_state, energy)
        if None not in (x_left, x_right):
            rot_line, = ax.plot([x_left, x_right], [energy / kT, energy / kT],
                                color='purple', label=f'{i}')
            labelLines([rot_line], xvals=[r_e], zorder=2.5)
    ax.plot(x, ground_state / kT, color='blue', linewidth=2, label='Ground state')
    ax.set_title('Rotational Levels')
    ax.grid(True)
    ax.set_xlim(xmin_rot, xmax_rot)

def main():
    # Define distance range and thermal energy scale
    xmin, xmax = 0.3, 3
    x = np.linspace(xmin, xmax, 200)
    kT = k * 300 / eV

    # Ground-state Morse potential parameters
    D_e = 4.75
    a = 1.93
    r_e = 0.741
    ground_state = morse_potential(x, D_e, a, r_e)

    # First excited state parameters (with offset)
    D_e_exc = 3.582
    a_exc = 2.0
    r_e_exc = 1.293
    offset_exc = 11.3694
    excited_state = morse_potential(x, D_e_exc, a_exc, r_e_exc, offset=offset_exc)

    # Create subplots using a mosaic layout
    fig, axs = plt.subplot_mosaic([[0, 1, 2]], figsize=(9, 3))
    plot_electronic_levels(axs[0], x, ground_state, excited_state, kT, r_e)

    # Calculate vibrational energy levels
    T_e = 0.0
    omega_e = 0.545681  # eV
    omega_ex_e = 0.015044  # eV
    v_max = 5
    v_levels = np.arange(v_max + 1)
    E_v = compute_vibrational_levels(v_levels, T_e, omega_e, omega_ex_e, D_e)

    xmin_rot, xmax_rot = 0.55, 1.0
    plot_vibrational_levels(axs[1], x, ground_state, E_v, kT, r_e)

    # Rotational energy levels for vibrational level v=0
    B_e_cm = 60.8530
    alpha_e_cm = 3.0622
    D_e_cm = 0.0471
    v = 0
    B_v_cm = B_e_cm - alpha_e_cm * (v + 0.5)
    D_v_cm = D_e_cm  # same for v=0
    cm_to_eV = 1.239841984e-4
    B_v_eV = B_v_cm * cm_to_eV
    D_v_eV = D_v_cm * cm_to_eV
    J_max = 4
    J_levels = np.arange(J_max + 1)
    rotational_offsets = B_v_eV * J_levels * (J_levels + 1) - D_v_eV * (J_levels * (J_levels + 1))**2
    E_rot_total = E_v[v] + rotational_offsets

    plot_rotational_levels(axs[2], x, ground_state, E_rot_total, kT, r_e, xmin_rot, xmax_rot)

    # Set axis limits for clarity
    axs[0].set_xlim(xmin, xmax)
    axs[1].set_xlim(xmin, 1.8)
    axs[2].set_xlim(xmin_rot, xmax_rot)
    axs[0].set_ylim(-200, 600)
    axs[1].set_ylim(-200, -50)
    axs[2].set_ylim(-174, -166)

    plt.tight_layout()
    plt.show()
    plt.close(fig)

if __name__ == "__main__":
    main()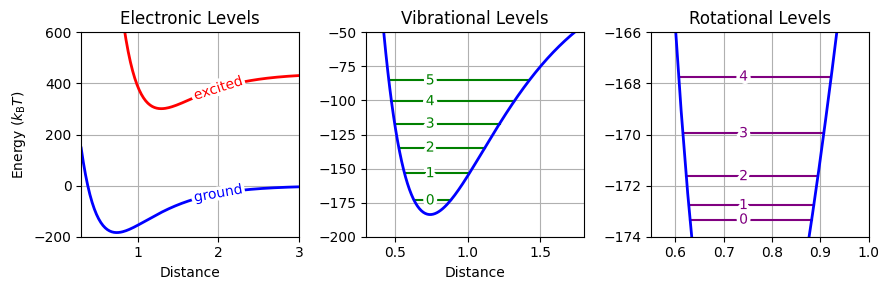
Energy level diagram for a diatomic molecule at 300 K (energies scaled by kT). The first subplot shows the ground and first excited electronic potential curves, the second displays the quantized vibrational levels over the ground-state potential, and the third presents the rotational levels for the v = 0 state.